Made by  Sweden, posted in Mathematics, on October 19, 2012 2:32 am

Aims in Maths: The students will learn about probability, the methods of solving probability
problems and how to apply this knowledge to everyday situations. The
students also learn how to use and analyse mathematical terms and their
interconnections.
|
This material rate is 1 of 5 points from 2 votes.
|
 |
Made by Sweden, posted in Mathematics, on March 19, 2013 2:04 am
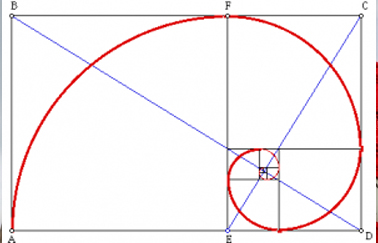
Core content from Curriculum for the Swedish compulsory school 2011 says that it is important to teach students
|
This material rate is 0 of 5 points from 0 votes.
|
|
Made by  Poland, posted in Mathematics, on May 12, 2013 10:14 pm
|
This material rate is 0 of 5 points from 0 votes.
|
 (9)
(9)
|
Made by  Italy, posted in Mathematics, on October 19, 2012 1:43 am
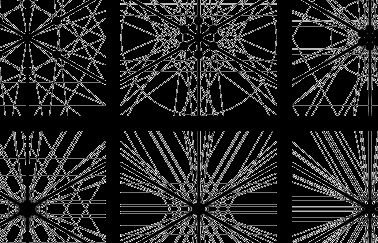
The teacher explains a few of the basic to using Geogebra such as how to make points, connect line segments, etc.
Students have a few minutes to play around and to whatever they want with the software.
The students complete worksheet “Investigating straight line”
|
This material rate is 1 of 5 points from 1 votes.
|
(29)
|
Made by Poland, posted in Mathematics, on August 14, 2012 12:03 am
Student:
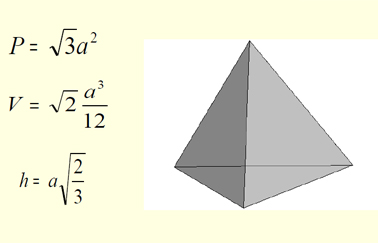
- is familiar with the concept of polyhedron;
- recognizes prisms and pyramids among polyhedrons;
- distinguishes polygons and knows their properties;
- distinguishes regular polygons;
- is able to define the concept of regular polyhedron, distinguish and name a particular polyhedron;
- is able to describe properties of every platonic solid;
|
This material rate is 0 of 5 points from 0 votes.
|
(30)
|
Made by Poland, posted in Mathematics, on August 13, 2012 11:58 pm
Student:
- is familiar with the concept of polyhedron;
- recognizes and names spatial solids;
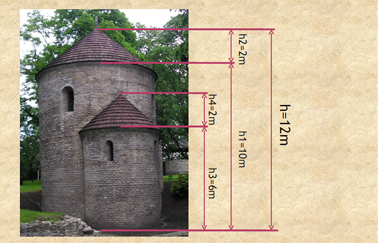
- shows practical use of spatial geometry in everyday life;
- finds elements of geometry in different fields, e.g. in chemistry, architecture, nature;
- uses simple calculation to establish the volume area and surface area of geometric models.
|
This material rate is 0.5 of 5 points from 4 votes.
|
(31)
|